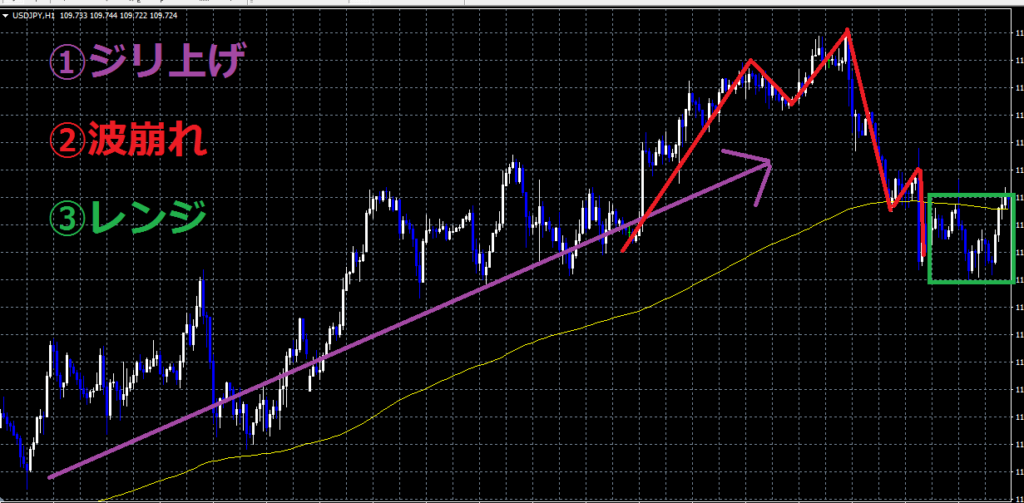
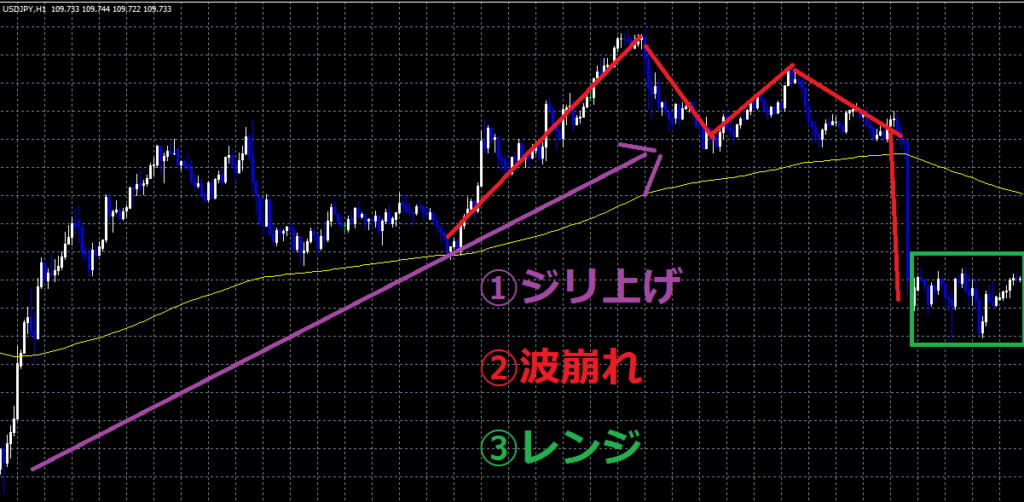
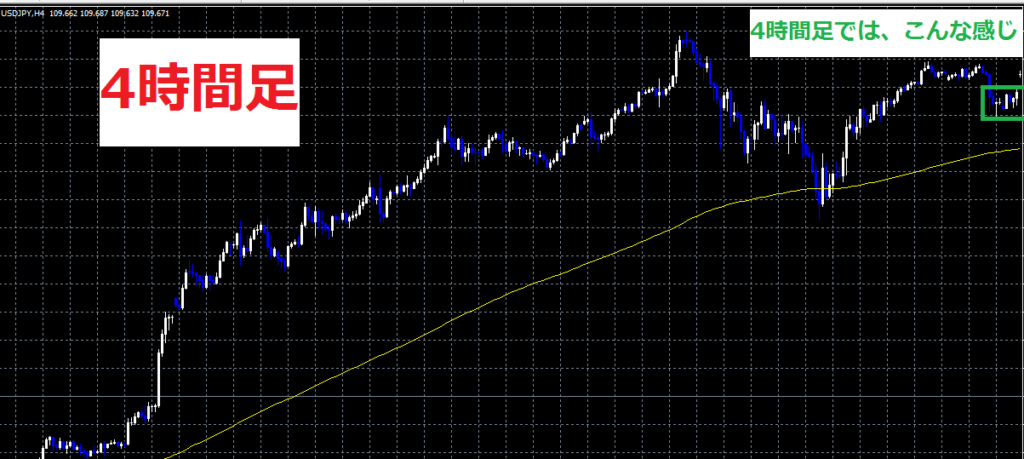
現在のドル円は、1時間レベルで、、、
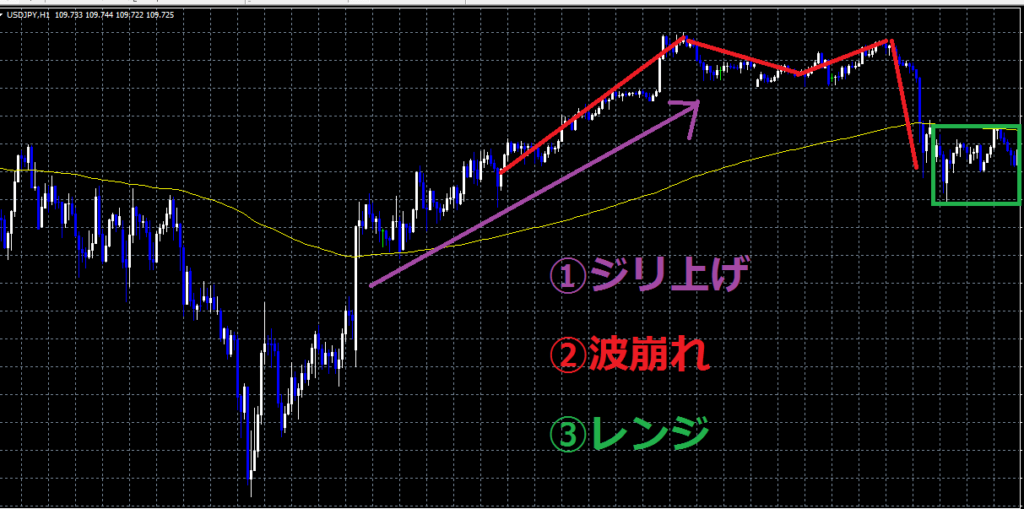
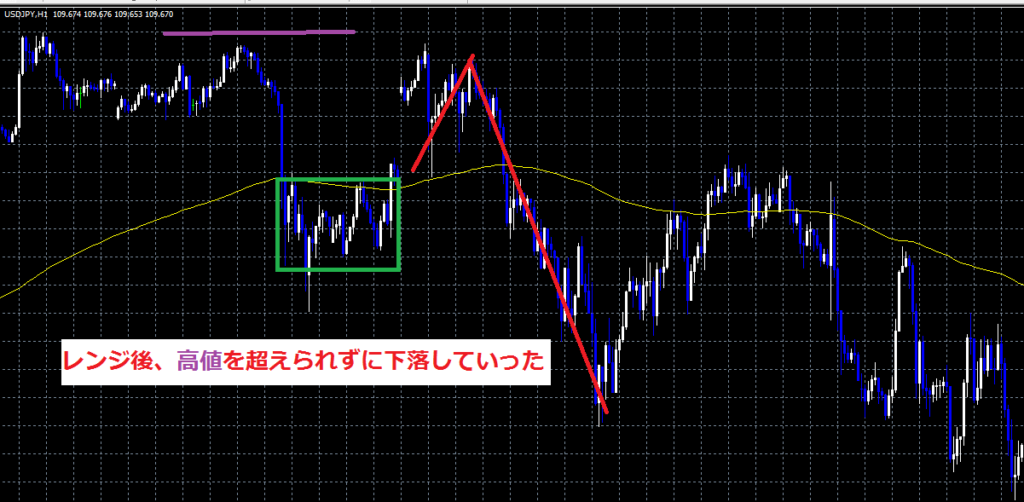
『ジリ上げ→波崩れ→レンジ』こんな感じのチャートを描いている。※下記画像参照
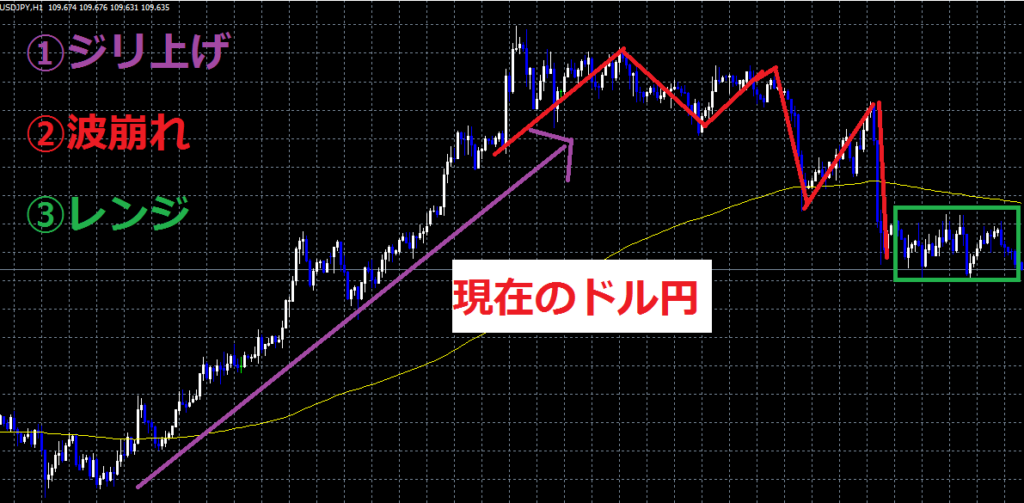
あくまでも、僕個人の意見であるが、こういったチャート(ジリ上げ→波崩れ→レンジ)を形成する時は、下落していく事が比較的多いと思ってる。
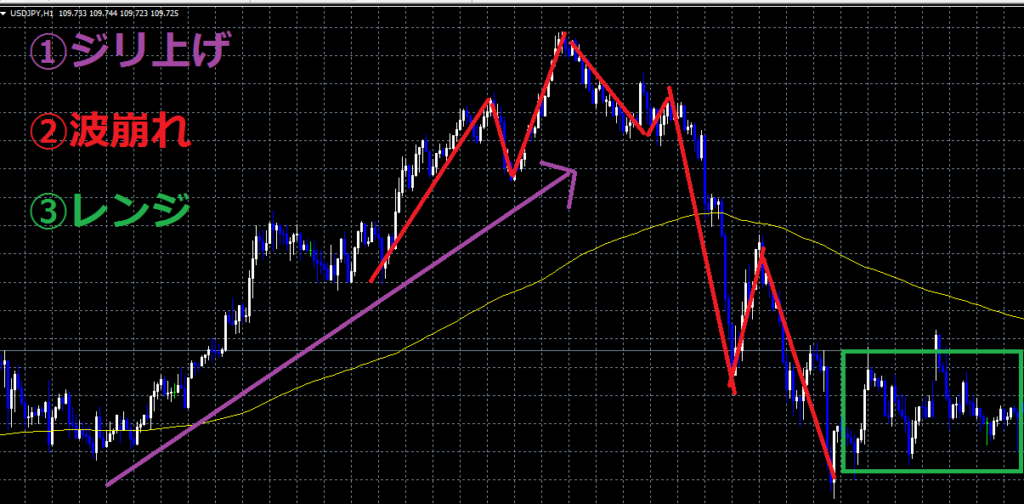
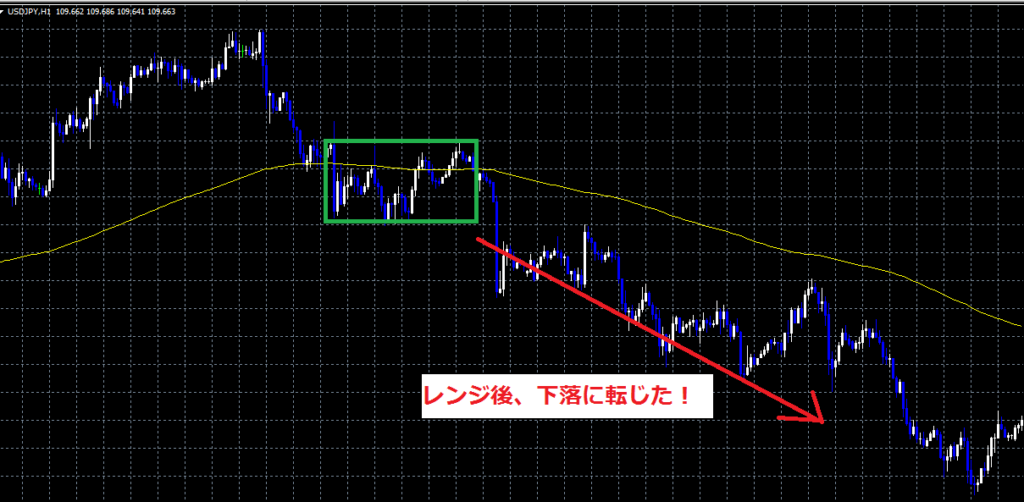
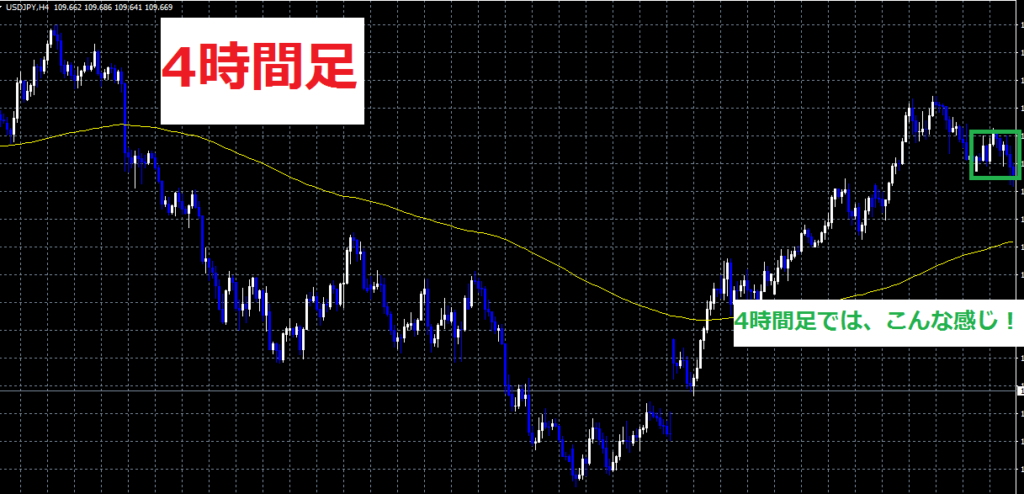
今回、過去チャートの中から【ジリ上げ→波崩れ→レンジ】パターンの画像を添付して置いたよ。今のチャートと似ていると思うので、何となくでもイメージを付けて貰えればと思う。
1枚目
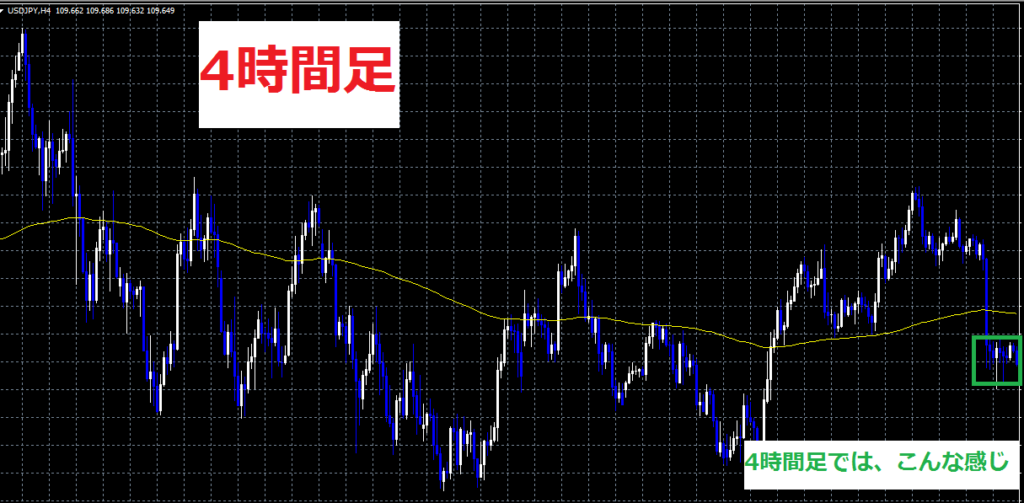
2枚目

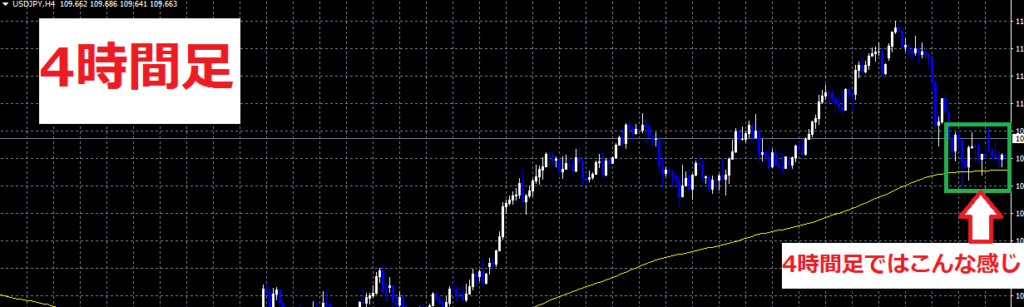
3枚目

4枚目
5枚目
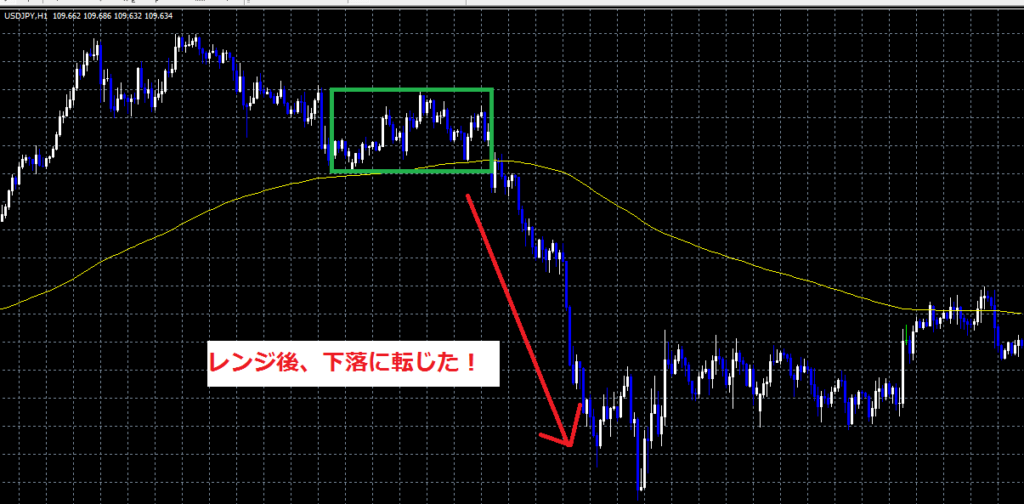
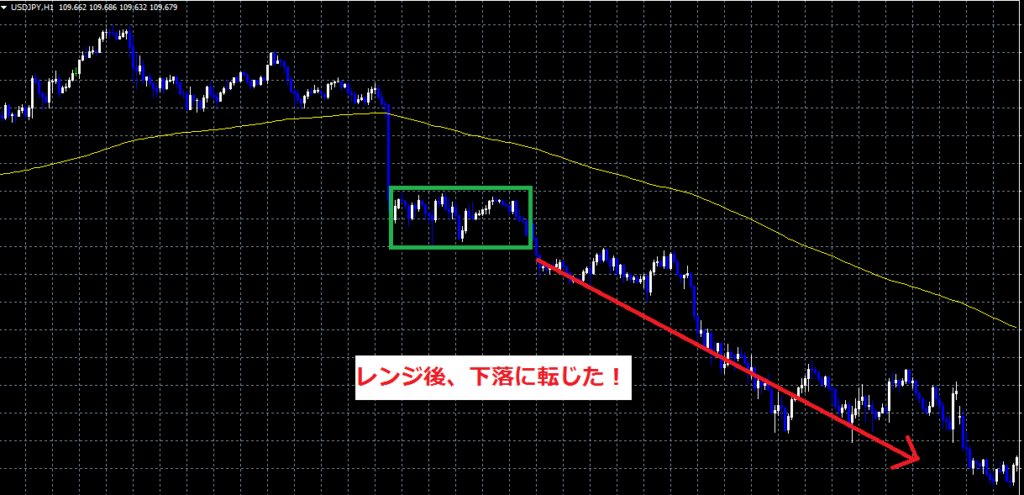
【ジリ上げ→波崩れ→レンジ→下落】この流れは、比較的良く見られるパターンである。※下記画像参照
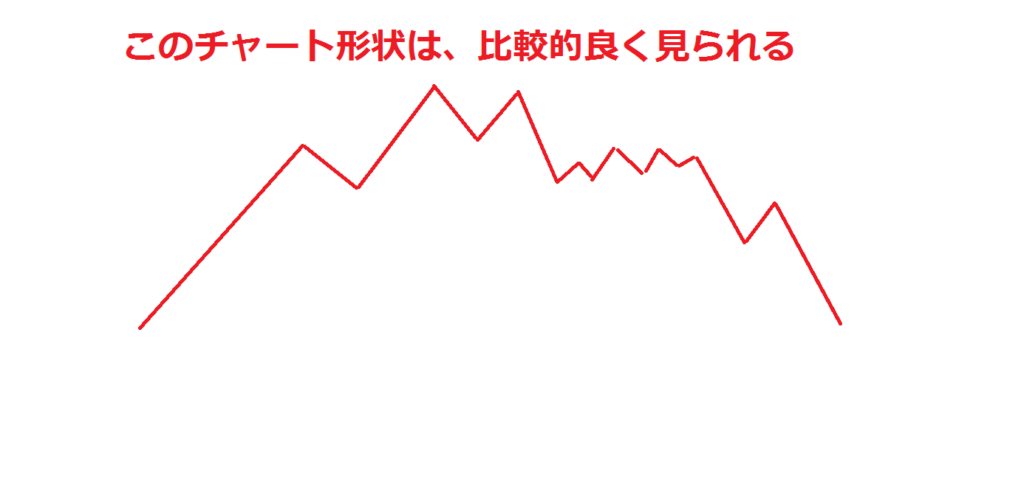
この形ごと頭に入れてしまうのが良い!!
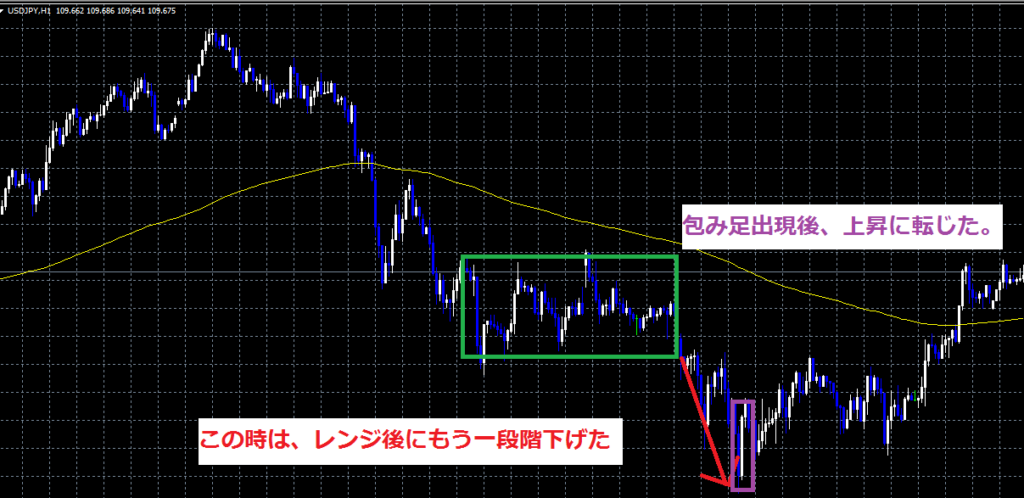
ただ、このチャート形状からの下落を期待出来るのは、価格が高値にある時だけだよ!是非、参考にしてみてね!
※もちろん、上昇する事もある