【解説】
ドル円の場合、基本的に
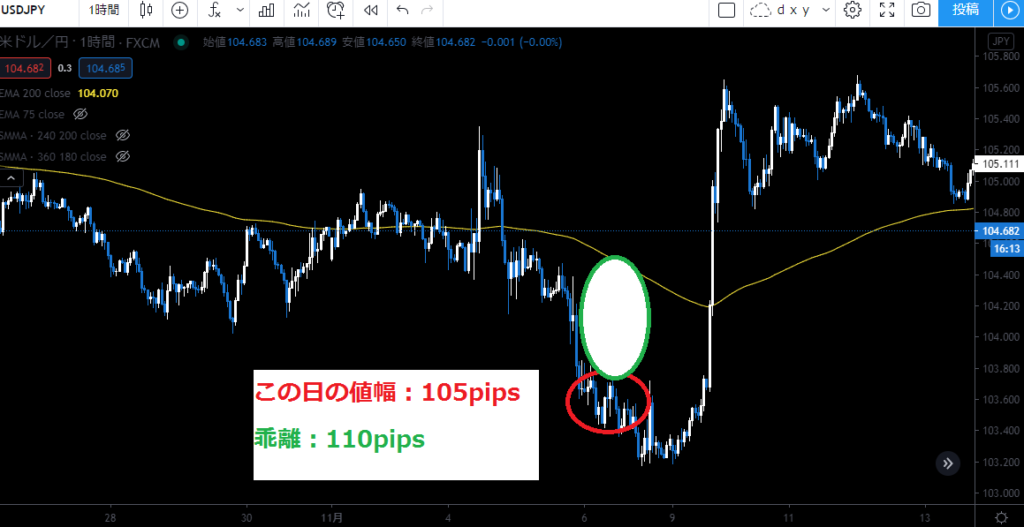
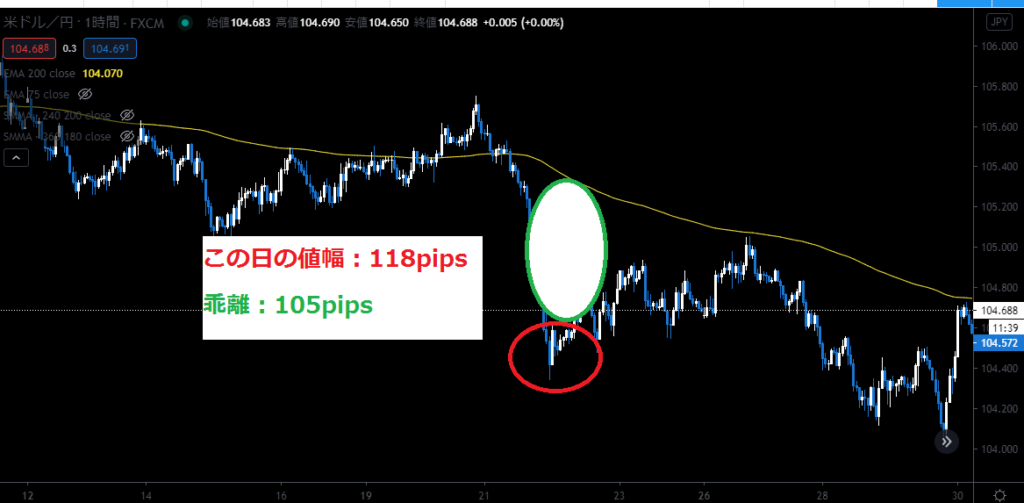
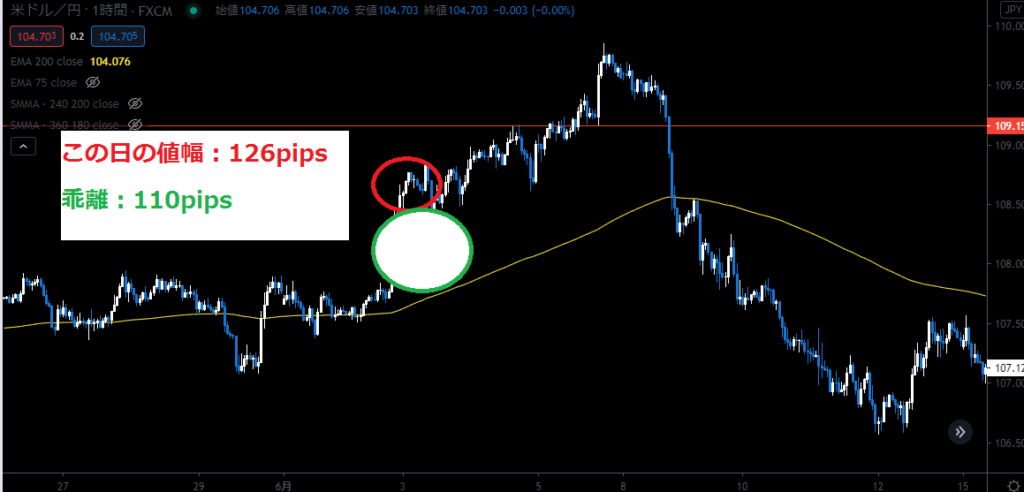
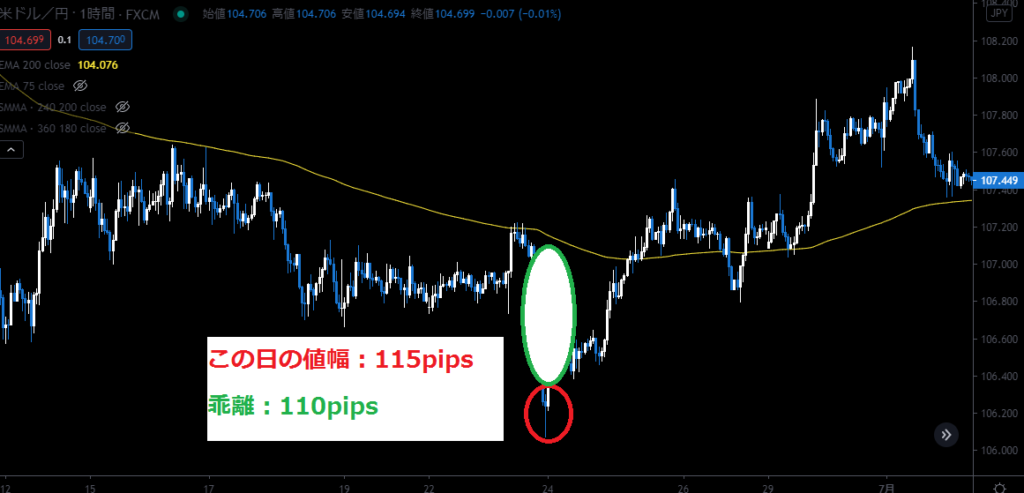
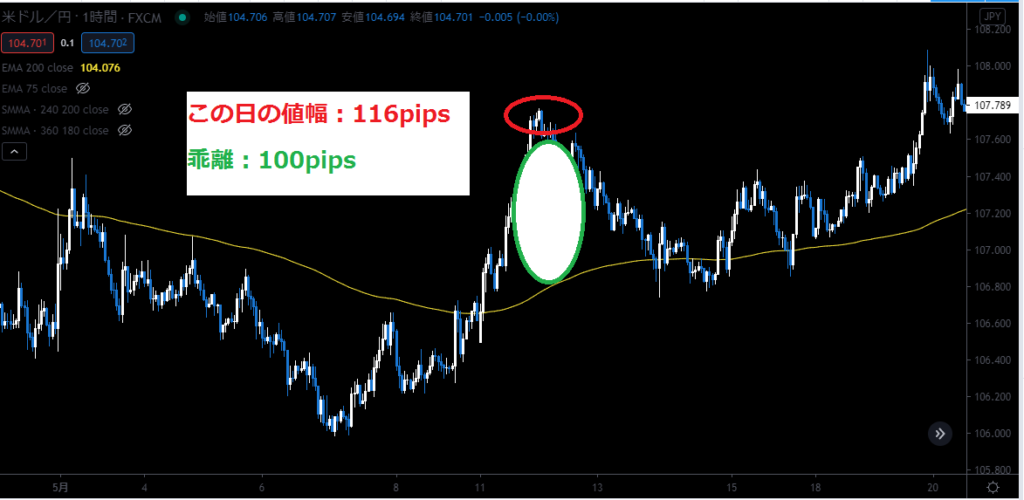
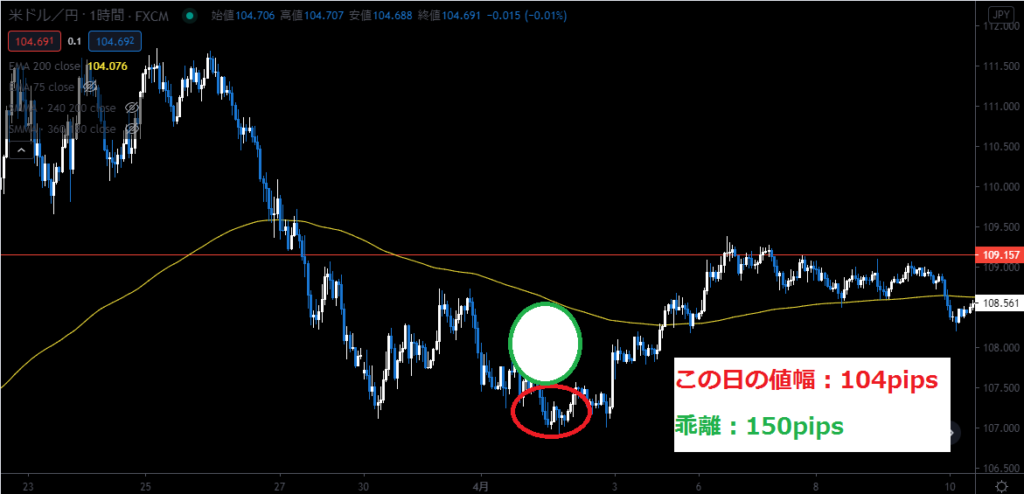
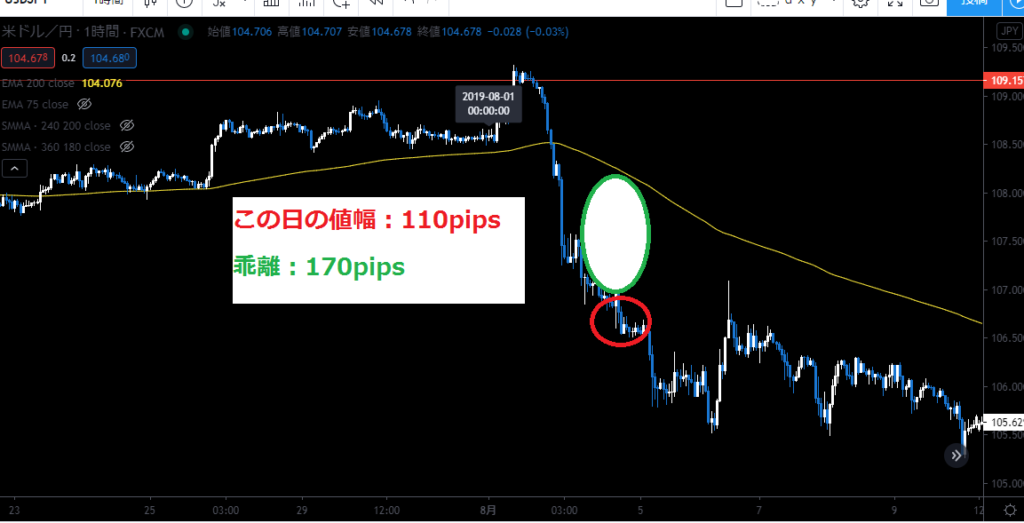
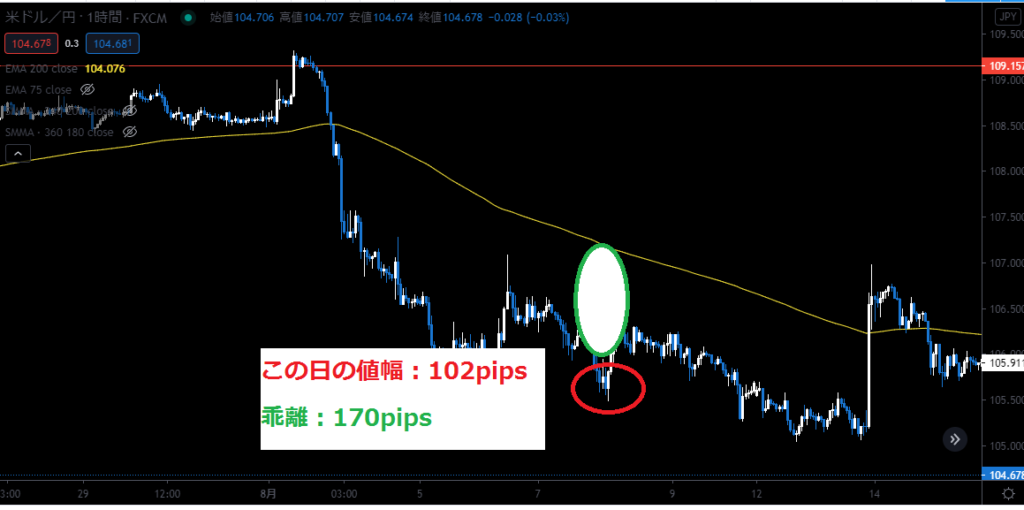
①1日の値幅が100pips以上
②200EMA乖離100pips以上
この2つが重なった時は、『上がり過ぎ・下がり過ぎ』サインの可能性が高い。
※ちなみに通常時のドル円の1日の値幅は50pips前後、200EMA乖離は30~50pipsくらい
このサインを一つの根拠にして『包み足』『ヒゲ』『急騰急落』などを組み合わせると良い!!
そして、このサインが朝方3:00~4:00くらいに出ると僕の中ではアツい!←これは、覚えて置いて損はないかな。
今回、【①値幅100pips以上②200EMA乖離100pips以上】この2つの条件に合致するチャート画像を用意したので、どういう風に動いたのかを見て頂ければと思う。


この条件に合致していても当然、含み損を抱える事はある。ただ、『時間』と『低レバ』を味方に付ければ何だかんだで助かる可能性が高い。だから、全く勝てない人はこの考え方を軸にしてみるのも良いと思う。
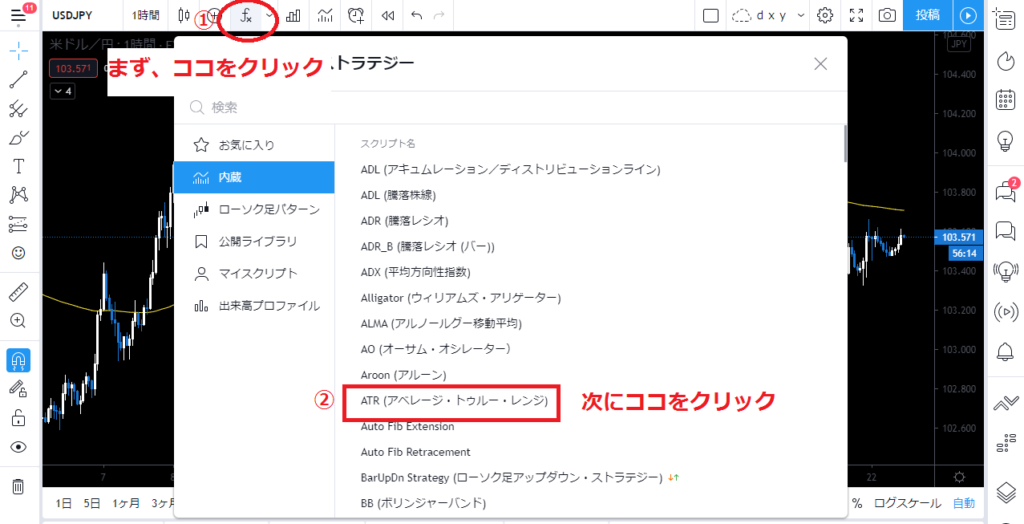
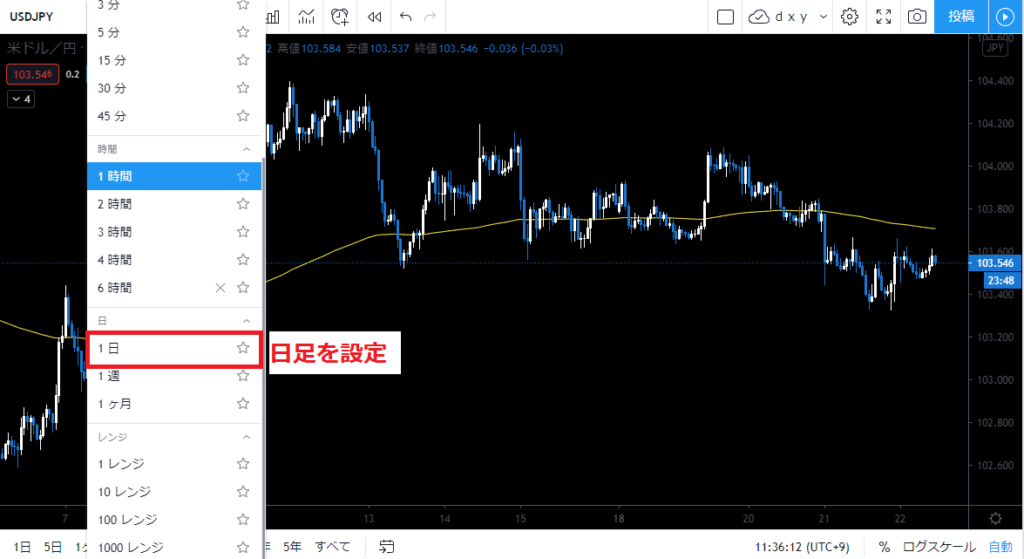
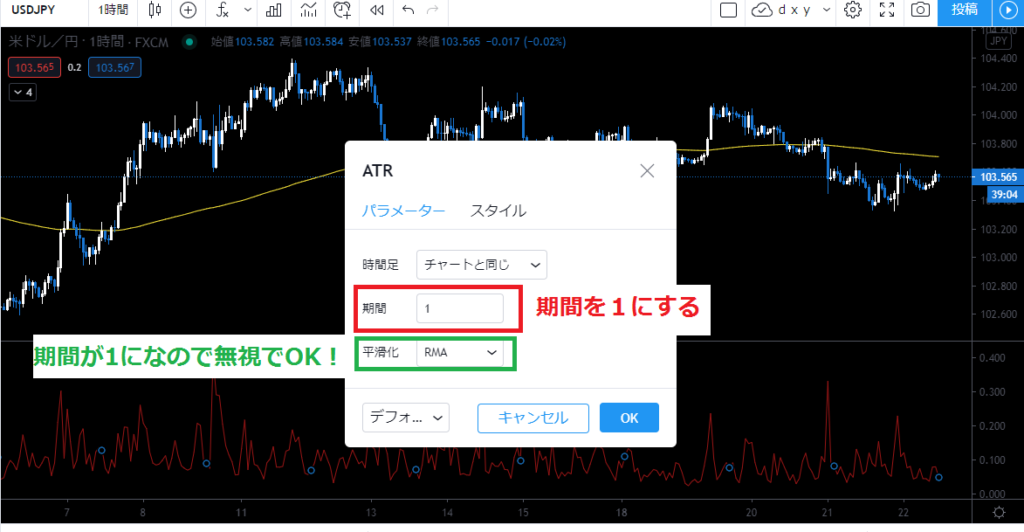
【1日の値幅が100pips以上の時に鳴るアラート設定方法】
設定サイトはコチラ
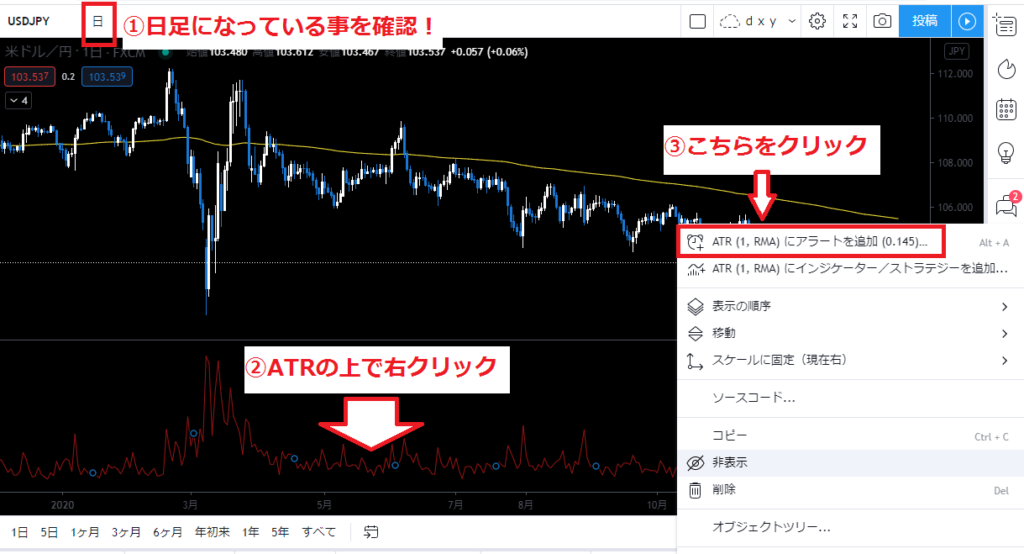

これでアラート完了!!設定サイトは↓